Key findings
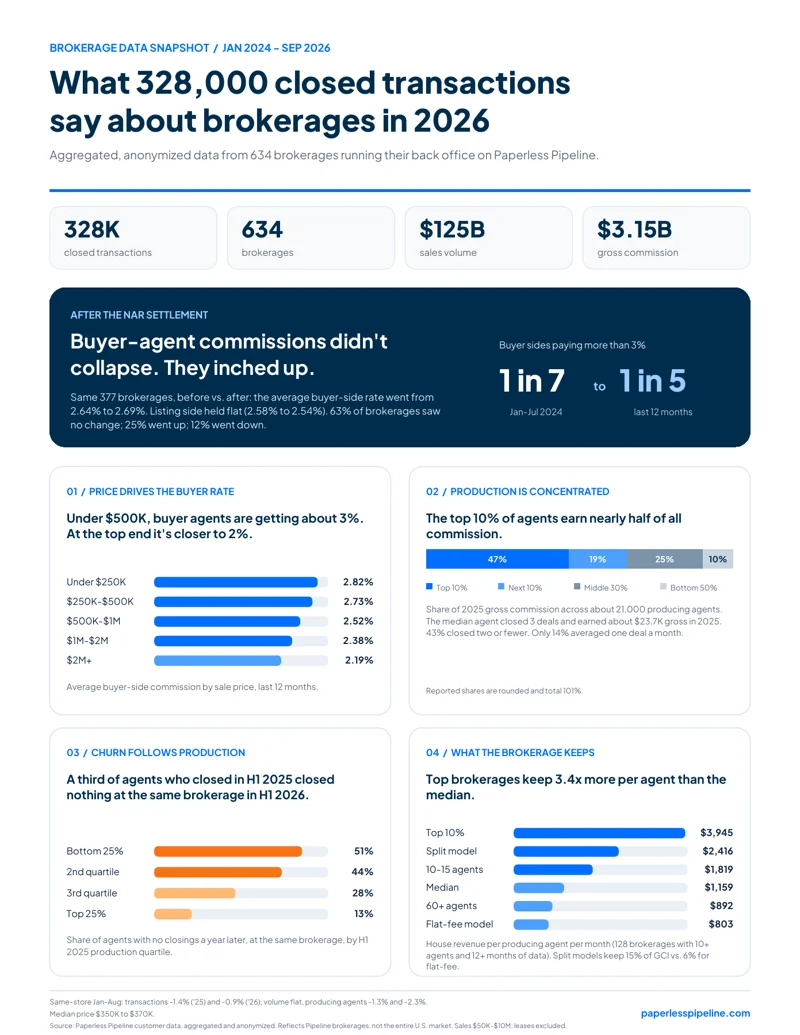
Across the same 377 Paperless Pipeline brokerages, the average buyer-side commission rate rose from 2.64% to 2.69% before versus after the NAR settlement.
The average buyer-side commission rate was 2.82% for sales under $250,000 and 2.19% for sales of $2 million or more in the last 12 months of the report.
The top 10% of producing agents earned 47% of 2025 gross commission across about 21,000 producing agents in Paperless Pipeline brokerages.
Among agents in the bottom H1 2025 production quartile, 51% had no closings at the same brokerage in H1 2026, compared with 13% in the top quartile.
Top-decile brokerages kept $3,945 per producing agent per month, compared with a median of $1,159, in a sample of 128 Paperless Pipeline brokerages.
01
Did buyer-agent commissions fall after the NAR settlement?
Not in this sample. Across the same 377 brokerages, the average buyer-side rate went from 2.64% to 2.69%. The listing-side rate moved from 2.58% to 2.54%.
Buyer-side rates were unchanged at 63% of brokerages, rose at 25% and fell at 12%. Buyer sides paying more than 3% increased from 1 in 7 in January-July 2024 to 1 in 5 in the last 12 months.
These are observed rates in Paperless Pipeline customer transactions, not a recommended or standard commission rate. Commission terms vary by transaction.
02
How does buyer-agent commission vary by home price?
Under $500,000, average buyer-side rates were close to 3%. At $2 million and above, the average was 2.19%.
| Sale price | Average buyer-side rate |
|---|---|
| Under $250K | 2.82% |
| $250K-$500K | 2.73% |
| $500K-$1M | 2.52% |
| $1M-$2M | 2.38% |
| $2M+ | 2.19% |
An office-wide average can hide differences between price bands. The figures below describe closed sales in this report, not the entire US housing market.
03
How much commission do top-producing real estate agents earn?
The top 10% of producing agents earned 47% of all 2025 gross commission in this sample. The next 10% earned 19%.
| Agent group | Share of 2025 gross commission |
|---|---|
| Top 10% | 47% |
| Next 10% | 19% |
| Middle 30% | 25% |
| Bottom 50% | 10% |
Across about 21,000 producing agents, the median agent closed 3 deals and earned about $23,700 gross in 2025. Of those agents, 43% closed two or fewer deals. Only 14% averaged one deal a month.
Gross commission is not take-home pay. Reported shares are rounded and total 101%.
Paperless Pipeline
Know what your brokerage keeps.
Track transactions and commissions in the same place.
04
How does agent production relate to brokerage retention?
A third of agents who closed in the first half of 2025 closed nothing at the same brokerage in the first half of 2026. Lower-producing agents were more likely to have no subsequent closings.
| H1 2025 production quartile | No closings at the same brokerage in H1 2026 |
|---|---|
| Bottom 25% | 51% |
| 2nd quartile | 44% |
| 3rd quartile | 28% |
| Top 25% | 13% |
The bottom production quartile had a 51% no-closing rate a year later, compared with 13% for the top quartile.
No closings at the same brokerage is the measure used here. It does not, by itself, establish that an agent left the brokerage or the industry.
05
How much revenue does a brokerage keep per agent?
The median was $1,159 per producing agent per month. Top-decile brokerages kept $3,945, about 3.4 times the median.
| Brokerage group | House revenue per producing agent / month |
|---|---|
| Top 10% | $3,945 |
| Split model | $2,416 |
| 10-15 agents | $1,819 |
| Median | $1,159 |
| 60+ agents | $892 |
| Flat-fee model | $803 |
This analysis covers 128 brokerages with at least 10 agents and at least 12 months of data. Split models kept 15% of gross commission, compared with 6% for flat-fee models.
Offices with 10-15 agents kept $1,819 per producing agent per month, compared with $892 for offices with 60 or more agents. These groups overlap; they are comparisons, not parts of a total. House revenue is not the same as profit.
06
What changed in same-store brokerage activity?
For January-August same-store comparisons, transactions fell 1.4% in 2025 and 0.9% in 2026. Sales volume was flat.
Producing-agent counts fell 1.3% and 2.3%, respectively. Median sale price rose from $350,000 to $370,000.
Methodology and limitations
Source: Paperless Pipeline customer transaction data, aggregated and anonymized. The report covers January 2024 through September 2026, with 328,000 closed transactions across 634 brokerages, $125 billion in sales volume and $3.15 billion in gross commission.
Sales from $50,000 to $10 million are included. Leases are excluded. This is a sample of Paperless Pipeline brokerages, not the entire US market or a nationally representative survey.
Each analysis uses its stated cohort and period: 377 matched brokerages for the settlement comparison; about 21,000 producing agents for 2025 commission shares; H1 2025 versus H1 2026 for no-closing comparisons; and 128 brokerages with 10+ agents and 12+ months of data for house revenue. Price-band rates use the report's last 12 months.
The supplied report does not specify weighting, exact settlement comparison cutoffs or all cohort-selection rules. Interpret these figures as descriptive observations, not causal estimates. Rounded commission shares total 101%.
Source report